2.0 How to Generate Project Dashboard Reports
3.0 Configure Project Dashboard
4.0 Generate Project Dashboard Reports
4.1 Package Distribution by State Report
4.2 Item/Versions Distribution by State Report
4.3 User Modified Items Report
4.4 Peer Review Report
4.5 Origination Repositories Report
4.6 Versions from Other Projects Report
4.7 Version Change Activity Report
Product: CA Harvest Software Change Manager
Release: 12.5
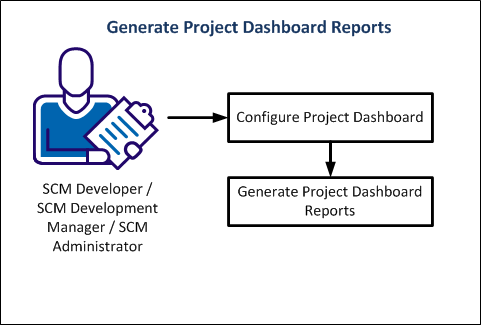
This scenario describes how a CA Harvest SCM Developer / Development Manager / Administrator configures and generates project dashboard reports.
The scenario addresses the need for generating dashboard reports in the Workbench. You can configure the default reports and generate a list of reports using the Project Dashboard.
This Knowledge Base Article constitutes a portion of the official CA product documentation for this CA product. This Knowledge Base Article is subject to the following notices, terms and conditions.
As an SCM Developer / Development Manager / Administrator, you can generate the following configured project dashboard reports:
Configured Dashboard Reports
The SCM Developer / Development Managers who have use access to the SCM project can configure and access these reports (developers using the Visual Studio as an IDE).
As a developer, you can generate the report that is based on the frequency of changes that you made. As a manager, you can generate the report that is based on the frequency of changes that the development team made.
The following diagram illustrates how an SCM Developer / Development Manager / Administrator configures the dashboard and can generate the project dashboard reports.
Configure the project dashboard to generate various reports.
Follow these steps:
Displays the count of package distribution across the states in the selected project.
Displays the details about the total items, modified items, total versions, and modified versions in the selected project.
Displays the total modified items and the total assigned packages for all the users in the selected project.
Displays the code review requests summary for the chosen project.
Provides the origination information about the baseline repository.
For Example: A sample report shows the following project origination information:
Now if you report on ProjectC, the origination information about RepA and RepB appears.
In this example, the report shows ProjectC’s RepA is derived from ProjectB’s SS2 and RepA is originated from ProjectA’s SS1.
Displays all versions which are merged from other projects to the current selected project.
Displays the frequency of the changes for a specified state and duration.
Displays information about the logged in users in the current session.
The configurations are saved to generate the report.
After you have configured the Project Dashboard, you can generate the following reports:
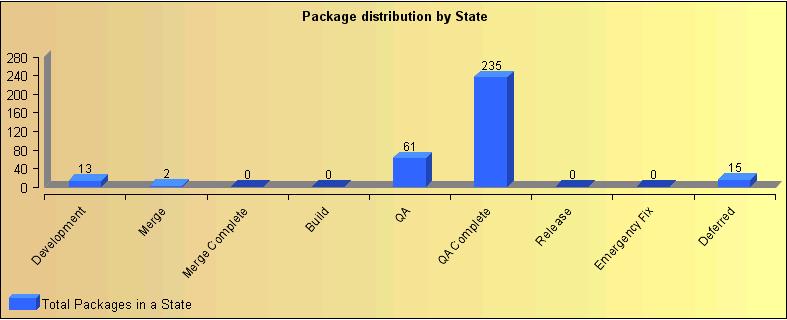
The package distribution by state report shows the number of packages that exist in each state at the current time. This report helps you to estimate the packages that are required to be completed before being promoted to the next state. You can generate a bar chart for this report with the State names on X-axis and the Package count on the Y-axis.
The following graph illustrates a sample package distribution report. This report displays the total packages that are created in each state by the users that are logged in at a given time.
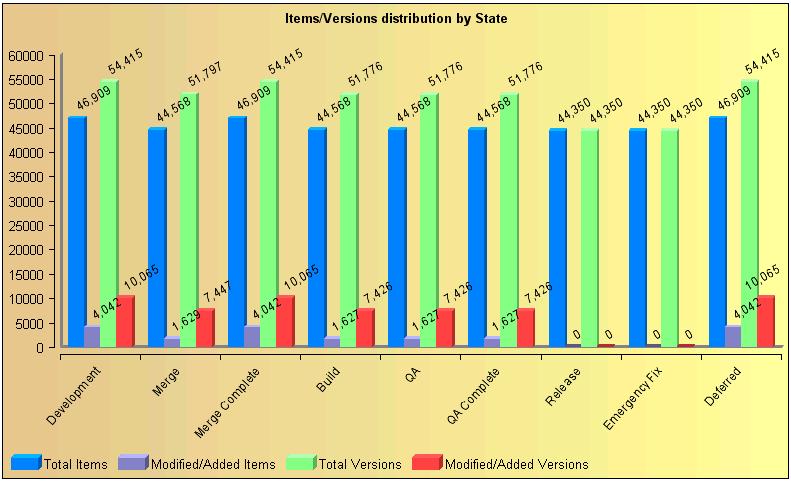
The item/versions distribution by state chart displays the following information for each state in the selected project:
The following graph illustrates a sample item/versions distribution by state report displaying information in a selected project.
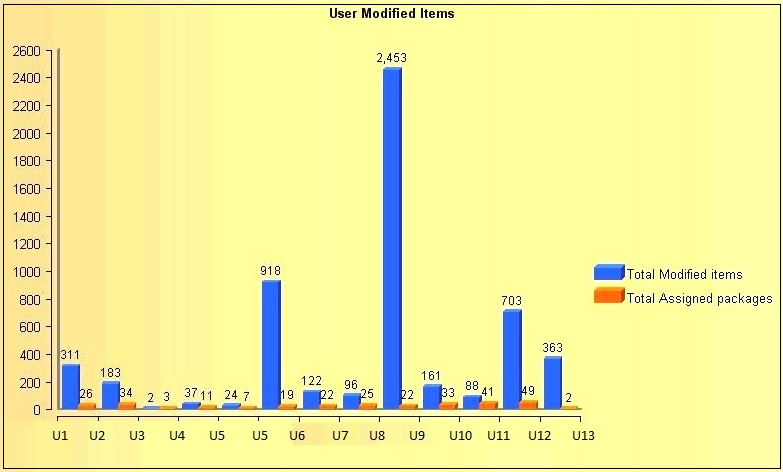
The user modified items report displays the total number of modified items by each user in the project and the number of working packages.
The following graph illustrates a sample user modified items report that displays total modified items against total assigned packages.
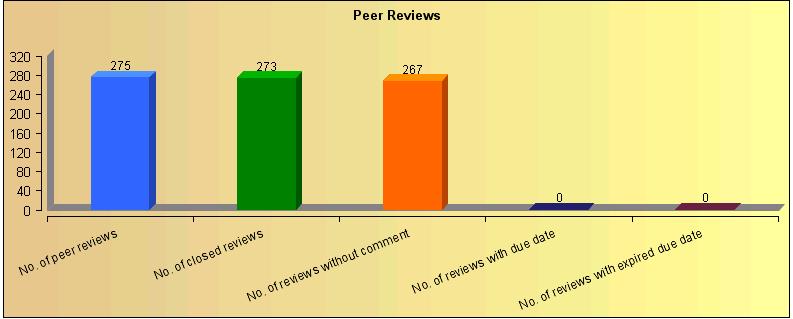
The peer review report displays the following peer reviews information in the form of a bar chart:
The following graph illustrates a sample peer review report.
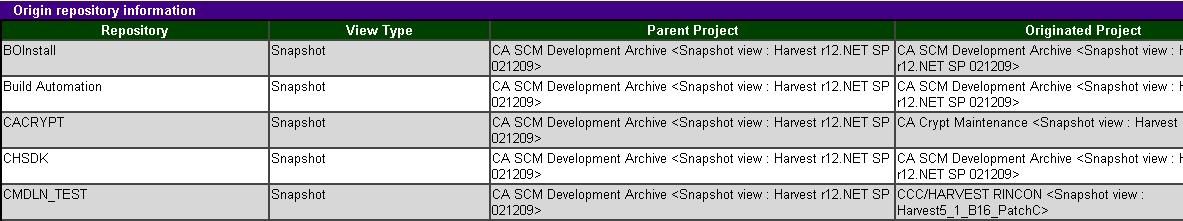
The origination repositories report provides origination information about the baseline repository in a tabular form.
Example:
A sample report shows the following project origination information:
Now if you report on ProjectC, the origination information about RepA and RepB appears.
In this example, the report shows ProjectC’s RepA is derived from ProjectB’s SS2 and RepA is originated from ProjectA’s SS1.
The following table displays a sample origination repositories information.
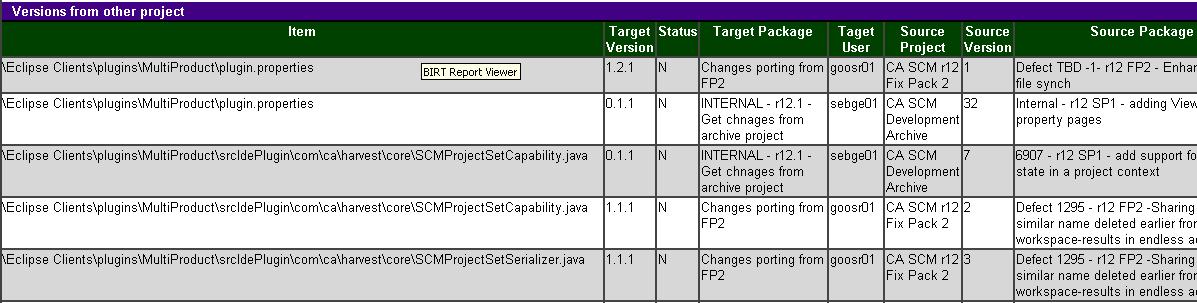
The Versions from Other Projects report displays all versions which are merged from other projects to the current selected project.
The following table displays a sample version from other project report.
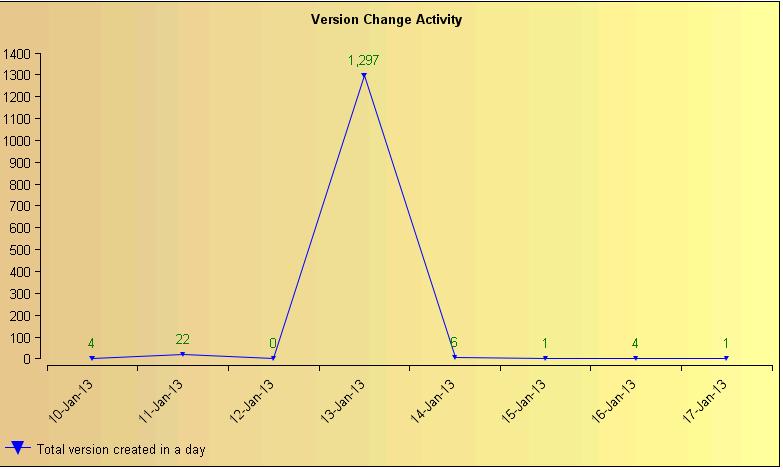
Version change activity report displays the graph on the frequency of the changes that are made to the SCM Repository over a period. This graph indicates time on X-axis and count of versions on the Y-axis.
Note: Depending on your access permissions, you can customize and generate the report that is based on the frequency of changes.
As a developer, you can generate the report that is based on the frequency of changes that you made. As a manager, you can generate the report that is based on the frequency of changes that the development team made.
The following graph illustrates a sample version change activity report that displays the total versions that are created at a given time.
This Documentation, which includes embedded help systems and electronically distributed materials, (hereinafter referred to as the “Documentation”) is for your informational purposes only and is subject to change or withdrawal by CA at any time.
This Documentation may not be copied, transferred, reproduced, disclosed, modified or duplicated, in whole or in part, without the prior written consent of CA. This Documentation is confidential and proprietary information of CA and may not be disclosed by you or used for any purpose other than as may be permitted in (i) a separate agreement between you and CA governing your use of the CA software to which the Documentation relates; or (ii) a separate confidentiality agreement between you and CA.
Notwithstanding the foregoing, if you are a licensed user of the software product(s) addressed in the Documentation, you may print or otherwise make available a reasonable number of copies of the Documentation for internal use by you and your employees in connection with that software, provided that all CA copyright notices and legends are affixed to each reproduced copy.
The right to print or otherwise make available copies of the Documentation is limited to the period during which the applicable license for such software remains in full force and effect. Should the license terminate for any reason, it is your responsibility to certify in writing to CA that all copies and partial copies of the Documentation have been returned to CA or destroyed.
TO THE EXTENT PERMITTED BY APPLICABLE LAW, CA PROVIDES THIS DOCUMENTATION “AS IS” WITHOUT WARRANTY OF ANY KIND, INCLUDING WITHOUT LIMITATION, ANY IMPLIED WARRANTIES OF MERCHANTABILITY, FITNESS FOR A PARTICULAR PURPOSE, OR NONINFRINGEMENT. IN NO EVENT WILL CA BE LIABLE TO YOU OR ANY THIRD PARTY FOR ANY LOSS OR DAMAGE, DIRECT OR INDIRECT, FROM THE USE OF THIS DOCUMENTATION, INCLUDING WITHOUT LIMITATION, LOST PROFITS, LOST INVESTMENT, BUSINESS INTERRUPTION, GOODWILL, OR LOST DATA, EVEN IF CA IS EXPRESSLY ADVISED IN ADVANCE OF THE POSSIBILITY OF SUCH LOSS OR DAMAGE.
The use of any software product referenced in the Documentation is governed by the applicable license agreement and such license agreement is not modified in any way by the terms of this notice.
The manufacturer of this Documentation is CA.
Provided with “Restricted Rights.” Use, duplication or disclosure by the United States Government is subject to the restrictions set forth in FAR Sections 12.212, 52.227-14, and 52.227-19(c)(1) - (2) and DFARS Section 252.227-7014(b)(3), as applicable, or their successors.
Copyright © 2013 CA. All rights reserved. All trademarks, trade names, service marks, and logos referenced herein belong to their respective companies.